Worldwide Ski Resort Forecasts

More
Colour guide Temperature · Wind · Rain · Snow
Each colour starts at the value shown. Wind colours match across all three units. Dry cells stay neutral. Colours describe the displayed values, not official weather warnings.
Preparing forecast graphs…
Times and values match the detailed forecast. Tap or point at a value for details. Scroll each chart sideways for later days. Rain / precipitation is the total water equivalent per forecast interval, including snow; snowfall is fresh snow per interval, not snow depth.
GFS and ECMWF model comparison. Each model retains its own forecast times and horizon. Precipitation and snowfall amounts cover their own forecast intervals; these can differ between models.
Forecast values and model notes
Alyeska Resort - Low lift station
ECMWF · Model run: Next update expected:
Day Time (UTC) Temp. (°C) Humidity (%) Wind (km/h) Wind (knots) Wind (Bft) Direction Precip. (mm) Snow (cm) Pressure (hPa) Freezing (m) Conditions | Thursday, 05/11 06:00 2.7 76 4 2 1B E — — 989 < 732 Overcast 90% cloud  09:00 2.1 75 4 2 1B E 1.0 0 988 < 732 Overcast 94% cloud 12:00 1.6 74 3 2 1B NE 0.79 0 988 < 732 Overcast 97% cloud 15:00 1.5 75 3 2 1B NE 0.47 0 987 < 732 Overcast 88% cloud 18:00 1.9 74 3 2 1B NE 0.25 0 987 < 732 Overcast 91% cloud 21:00 2.8 75 4 2 1B NE 0.32 0 987 < 732 Overcast 96% cloud Friday, 06/11 00:00 3 74 2 1 1B NE 0.28 0 985 < 732 Cloudy 66% cloud  03:00 -2.1 72 4 2 1B N 0 0 982 < 732 Cloudy 56% cloud 06:00 -5.3 68 6 3 1B N 0 0 981 < 732 Cloudy 67% cloud 09:00 -5.1 66 5 2 1B N 0 0 981 < 732 Cloudy 78% cloud 12:00 -4.9 67 4 2 1B N 0 0 981 < 732 Overcast 97% cloud 15:00 -4.6 67 4 2 1B NW 0 0 981 < 732 Overcast 95% cloud 18:00 -6.5 66 4 2 1B N 0 0 982 < 732 Overcast 86% cloud 21:00 -3.3 62 3 1 1B N 0 0 983 < 732 Overcast 82% cloud Saturday, 07/11 00:00 -2.3 63 2 1 1B NW 0 0 984 < 732 Overcast 99% cloud 03:00 -3.8 61 2 1 1B N 0 0 985 < 732 Overcast 99% cloud 06:00 -4.2 61 1 1 1B N 0 0 988 < 732 Overcast 99% cloud 09:00 -2.7 56 2 1 1B NE 0 0 991 < 732 Overcast 100% cloud 12:00 -1.4 59 2 1 1B E 0.21 0 993 < 732 Overcast 99% cloud 15:00 -0.5 66 3 2 1B E 0.28 0.1 995 < 732 Overcast 97% cloud 18:00 0.1 69 4 2 1B E 0.24 0 997 < 732 Overcast 99% cloud 21:00 2.2 70 5 3 1B E 0.36 0 997 < 732 Overcast 95% cloud Sunday, 08/11 00:00 2.2 74 4 2 1B NE 0.46 0 996 < 732 Overcast 86% cloud 03:00 -0 72 4 2 1B E 0.74 0.2 996 < 732 Cloudy 74% cloud 06:00 -0.7 71 3 2 1B NE 0.06 0 996 < 732 Cloudy 68% cloud 09:00 -3.1 69 4 2 1B N 0 0 994 < 732 Overcast 89% cloud 12:00 -5.8 67 4 2 1B N 0 0 992 < 732 Cloudy 78% cloud 15:00 -5.6 66 3 1 1B N 0 0 991 < 732 Overcast 100% cloud 18:00 -5.8 67 2 1 1B N 0.10 0.1 992 < 732 Overcast 100% cloud 21:00 -3.2 62 1 1 1B NE 0 0 993 < 732 Overcast 100% cloud Monday, 09/11 00:00 -1.6 61 4 2 1B E 0 0 994 < 732 Overcast 100% cloud 03:00 -3.5 63 4 2 1B E 0 0 996 < 732 Overcast 94% cloud 06:00 -1.7 67 5 3 1B E 0.02 0 998 < 732 Cloudy 79% cloud 09:00 -1.7 69 5 3 1B E 0.17 0 999 < 732 Overcast 96% cloud 12:00 -1.1 69 6 3 2B NE 0.18 0 998 < 732 Overcast 99% cloud 15:00 -2.1 67 6 3 2B NE 0.11 0 995 < 732 Overcast 100% cloud 18:00 -2.4 61 5 3 1B N 0 0 989 < 732 Overcast 100% cloud 21:00 -0.7 64 3 2 1B N 0.78 0.2 984 < 732 Overcast 100% cloud Tuesday, 10/11 00:00 0 70 6 3 1B NE 4.2 1.7 980 < 732 Overcast 100% cloud 03:00 1.3 76 5 3 1B NE 5.7 0 978 < 732 Overcast 100% cloud 06:00 1.3 72 5 3 1B N 2.3 0 975 < 732 Overcast 97% cloud 09:00 2.5 70 4 2 1B N 1.5 0 971 1009 Overcast 100% cloud 12:00 2.3 78 2 1 1B NE 6.9 0 971 < 732 Overcast 100% cloud 15:00 3.4 73 10 6 2B E 11.7 0 972 < 732 Overcast 100% cloud 18:00 3.8 75 9 5 2B E 11.7 0 974 780 Overcast 100% cloud 21:00 4.1 77 11 6 2B E 12.5 0 977 862 Overcast 100% cloud Wednesday, 11/11 00:00 3.9 76 10 5 2B E 6.8 0 981 805 Overcast 98% cloud 03:00 3.4 77 7 4 2B E 5.1 0 983 < 732 Overcast 100% cloud 06:00 2.6 78 3 2 1B E 2.3 0 984 < 732 Overcast 98% cloud |
|---|
Forecast notes
Forecast table times: UTC.
Coordinates: 60.96013°N, -149.1115194°E · Requested elevation: 76 m. Model terrain: 730 m. Terrain and 1000/925/850/700 hPa profiles are used for height estimates.
Outside the available profile, temperature uses an estimated 5.5°C/km height correction; wind retains the nearest available model-level value. Humidity is estimated with adjusted pressure and temperature.
These are altitude estimates, not a simulation of local mountain terrain. Precipitation, cloud and sea-level pressure use horizontal interpolation only.
Precipitation includes rain and snow water equivalent: preceding 3 hours through day 6, then 6 hours (see cell tooltip). Snow (cm) estimates fresh snowfall from precipitation and temperature using the GFS conversion; it is not snow depth on the ground. Freezing (m) uses additional 600/500 hPa temperatures when available and estimates the lowest resolved 0°C crossing above sea level. When all sampled levels are warm, the upper profile limit is shown (see tooltip). < marks an entirely cold sampled profile and its lower height limit. No extrapolation is used.
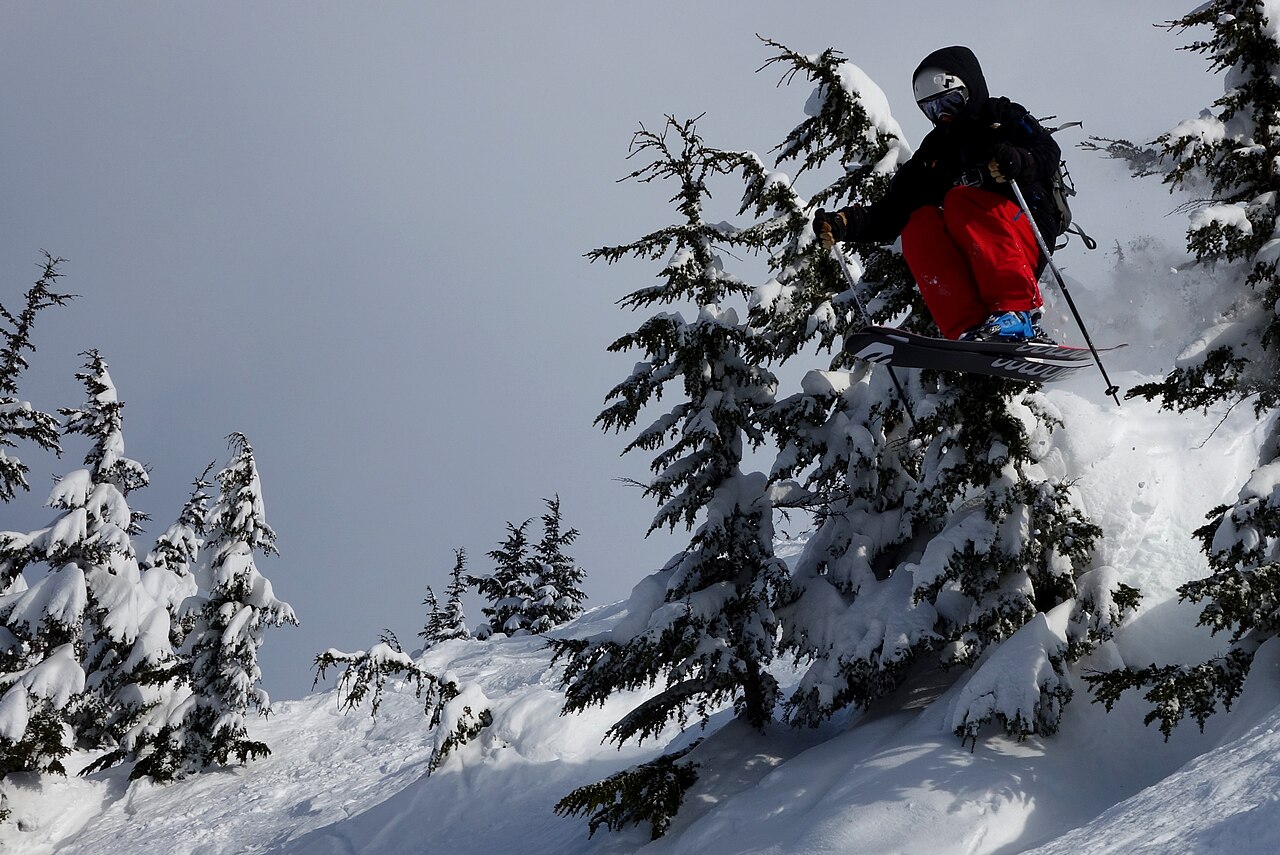
Alyeska Resort is a downhill ski area in Alaska, United States. Mapped terrain includes beginner, easy, intermediate, advanced routes. Its mapped lift network extends from approximately 76 to 838 metres above sea level.
Data: OpenSkiData / OpenSkiMap, OpenStreetMap contributors (ODbL), Skimap.org, Who's On First, Mapterhorn.
Preparing forecast graphs…
Times and values match the detailed forecast. Tap or point at a value for details. Scroll each chart sideways for later days. Rain / precipitation is the total water equivalent per forecast interval, including snow; snowfall is fresh snow per interval, not snow depth.
GFS and ECMWF model comparison. Each model retains its own forecast times and horizon. Precipitation and snowfall amounts cover their own forecast intervals; these can differ between models.
Forecast values and model notes
Alyeska Resort - Base lift station
ECMWF · Model run: Next update expected:
Day Time (UTC) Temp. (°C) Humidity (%) Wind (km/h) Wind (knots) Wind (Bft) Direction Precip. (mm) Snow (cm) Pressure (hPa) Freezing (m) Conditions | Thursday, 05/11 06:00 2.6 77 4 2 1B E — — 989 < 731 Overcast 90% cloud 09:00 2 75 4 2 1B E 1.0 0 988 < 731 Overcast 94% cloud 12:00 1.6 74 3 2 1B NE 0.79 0 988 < 731 Overcast 97% cloud 15:00 1.4 75 3 2 1B NE 0.48 0 987 < 731 Overcast 88% cloud 18:00 1.9 74 3 2 1B NE 0.26 0 987 < 731 Overcast 91% cloud 21:00 2.8 75 4 2 1B NE 0.32 0 987 < 731 Overcast 96% cloud Friday, 06/11 00:00 3 74 2 1 1B NE 0.28 0 985 < 731 Cloudy 66% cloud 03:00 -2.1 72 4 2 1B N 0 0 982 < 731 Cloudy 56% cloud 06:00 -5.3 69 6 3 1B N 0 0 981 < 731 Cloudy 68% cloud 09:00 -5.1 67 4 2 1B N 0 0 981 < 731 Cloudy 78% cloud 12:00 -5 67 4 2 1B N 0 0 981 < 731 Overcast 97% cloud 15:00 -4.6 67 4 2 1B NW 0 0 981 < 731 Overcast 95% cloud 18:00 -6.5 66 4 2 1B N 0 0 982 < 731 Overcast 86% cloud 21:00 -3.3 62 3 1 1B N 0 0 983 < 731 Overcast 82% cloud Saturday, 07/11 00:00 -2.3 63 2 1 1B NW 0 0 984 < 731 Overcast 99% cloud 03:00 -3.8 61 2 1 1B N 0 0 985 < 731 Overcast 99% cloud 06:00 -4.2 61 1 1 1B N 0 0 988 < 731 Overcast 99% cloud 09:00 -2.7 56 2 1 1B NE 0 0 991 < 731 Overcast 100% cloud 12:00 -1.5 59 2 1 1B E 0.21 0 993 < 731 Overcast 99% cloud 15:00 -0.6 66 3 2 1B E 0.28 0.1 995 < 731 Overcast 97% cloud 18:00 0 69 4 2 1B E 0.24 0 997 < 731 Overcast 99% cloud 21:00 2.1 70 5 2 1B E 0.36 0 997 < 731 Overcast 95% cloud Sunday, 08/11 00:00 2.1 74 4 2 1B NE 0.46 0 996 < 731 Overcast 87% cloud 03:00 -0.1 73 4 2 1B E 0.75 0.2 996 < 731 Cloudy 74% cloud 06:00 -0.8 71 3 2 1B NE 0.07 0 996 < 731 Cloudy 68% cloud 09:00 -3.1 69 4 2 1B N 0 0 994 < 731 Overcast 90% cloud 12:00 -5.9 67 4 2 1B N 0 0 992 < 731 Cloudy 78% cloud 15:00 -5.7 66 3 1 1B N 0 0 991 < 731 Overcast 100% cloud 18:00 -5.8 67 2 1 1B N 0.10 0.1 992 < 731 Overcast 100% cloud 21:00 -3.3 62 1 1 1B NE 0 0 993 < 731 Overcast 100% cloud Monday, 09/11 00:00 -1.6 61 3 2 1B E 0 0 994 < 731 Overcast 99% cloud 03:00 -3.5 64 4 2 1B E 0 0 996 < 731 Overcast 94% cloud 06:00 -1.8 67 5 3 1B E 0.02 0 998 < 731 Cloudy 79% cloud 09:00 -1.8 69 5 3 1B E 0.17 0 999 < 731 Overcast 96% cloud 12:00 -1.2 69 6 3 2B NE 0.19 0 998 < 731 Overcast 99% cloud 15:00 -2.1 68 6 3 2B NE 0.11 0 995 < 731 Overcast 100% cloud 18:00 -2.5 61 5 3 1B N 0 0 989 < 731 Overcast 100% cloud 21:00 -0.7 64 3 2 1B N 0.78 0.2 984 < 731 Overcast 100% cloud Tuesday, 10/11 00:00 -0 71 6 3 1B NE 4.2 1.7 980 < 731 Overcast 100% cloud 03:00 1.2 76 5 3 1B NE 5.7 0 978 < 731 Overcast 100% cloud 06:00 1.3 73 5 3 1B N 2.3 0 975 < 731 Overcast 97% cloud 09:00 2.4 71 4 2 1B N 1.5 0 971 1011 Overcast 100% cloud 12:00 2.2 78 2 1 1B NE 6.9 0 971 < 731 Overcast 100% cloud 15:00 3.4 74 10 5 2B E 11.7 0 972 < 731 Overcast 100% cloud 18:00 3.7 75 9 5 2B E 11.7 0 974 778 Overcast 100% cloud 21:00 4.1 77 11 6 2B E 12.5 0 977 861 Overcast 100% cloud Wednesday, 11/11 00:00 3.9 76 10 5 2B E 6.8 0 981 805 Overcast 98% cloud 03:00 3.3 78 7 4 2B E 5.1 0 983 < 731 Overcast 100% cloud 06:00 2.5 78 3 2 1B E 2.4 0 984 < 731 Overcast 98% cloud |
|---|
Forecast notes
Forecast table times: UTC.
Coordinates: 60.9586003°N, -149.1102286°E · Requested elevation: 85 m. Model terrain: 729 m. Terrain and 1000/925/850/700 hPa profiles are used for height estimates.
Outside the available profile, temperature uses an estimated 5.5°C/km height correction; wind retains the nearest available model-level value. Humidity is estimated with adjusted pressure and temperature.
These are altitude estimates, not a simulation of local mountain terrain. Precipitation, cloud and sea-level pressure use horizontal interpolation only.
Precipitation includes rain and snow water equivalent: preceding 3 hours through day 6, then 6 hours (see cell tooltip). Snow (cm) estimates fresh snowfall from precipitation and temperature using the GFS conversion; it is not snow depth on the ground. Freezing (m) uses additional 600/500 hPa temperatures when available and estimates the lowest resolved 0°C crossing above sea level. When all sampled levels are warm, the upper profile limit is shown (see tooltip). < marks an entirely cold sampled profile and its lower height limit. No extrapolation is used.
Preparing forecast graphs…
Times and values match the detailed forecast. Tap or point at a value for details. Scroll each chart sideways for later days. Rain / precipitation is the total water equivalent per forecast interval, including snow; snowfall is fresh snow per interval, not snow depth.
GFS and ECMWF model comparison. Each model retains its own forecast times and horizon. Precipitation and snowfall amounts cover their own forecast intervals; these can differ between models.
Forecast values and model notes
Alyeska Resort - Top lift station
ECMWF · Model run: Next update expected:
Day Time (UTC) Temp. (°C) Humidity (%) Wind (km/h) Wind (knots) Wind (Bft) Direction Precip. (mm) Snow (cm) Pressure (hPa) Freezing (m) Conditions | Thursday, 05/11 06:00 -1.2 91 9 5 2B E — — 989 < 752 Overcast 91% cloud 09:00 -1.7 90 8 4 2B E 1.2 0.4 988 < 752 Overcast 95% cloud 12:00 -2.1 90 6 3 2B E 0.93 0.3 988 < 752 Overcast 97% cloud 15:00 -2.2 91 6 3 2B E 0.54 0.2 987 < 752 Overcast 89% cloud 18:00 -1.9 90 6 3 2B E 0.29 0.1 987 < 752 Overcast 93% cloud 21:00 -1.2 90 6 3 1B E 0.38 0.1 987 < 752 Overcast 97% cloud Friday, 06/11 00:00 -1 88 4 2 1B NE 0.32 0.1 985 < 752 Cloudy 67% cloud 03:00 -5.1 83 6 3 2B N 0 0 982 < 752 Cloudy 59% cloud 06:00 -7.7 79 8 4 2B N 0 0 981 < 752 Cloudy 68% cloud 09:00 -7.7 77 7 4 2B N 0 0 981 < 752 Cloudy 78% cloud 12:00 -7.7 79 7 4 2B N 0 0 981 < 752 Overcast 97% cloud 15:00 -7.5 79 6 3 2B NW 0 0 981 < 752 Overcast 95% cloud 18:00 -9.2 80 6 3 1B NW 0 0 982 < 752 Overcast 87% cloud 21:00 -6.5 74 4 2 1B NW 0 0 983 < 752 Overcast 84% cloud Saturday, 07/11 00:00 -5.8 73 3 2 1B NW 0 0 984 < 752 Overcast 100% cloud 03:00 -6.8 71 3 2 1B N 0 0 985 < 752 Overcast 99% cloud 06:00 -7.2 71 2 1 1B N 0 0 988 < 752 Overcast 99% cloud 09:00 -6 67 4 2 1B E 0 0 991 < 752 Overcast 100% cloud 12:00 -5 75 4 2 1B E 0.24 0.2 993 < 752 Overcast 99% cloud 15:00 -4.2 82 5 3 1B E 0.32 0.3 995 < 752 Overcast 96% cloud 18:00 -3.8 85 7 4 2B E 0.27 0.3 997 < 752 Overcast 99% cloud 21:00 -2 86 8 4 2B E 0.42 0.1 997 < 752 Overcast 96% cloud Sunday, 08/11 00:00 -2.1 90 6 3 2B E 0.59 0.2 996 < 752 Overcast 88% cloud 03:00 -3.9 88 7 4 2B E 0.87 0.9 996 < 752 Cloudy 76% cloud 06:00 -4.7 86 6 3 1B E 0.07 0.1 996 < 752 Cloudy 71% cloud 09:00 -6.5 83 5 2 1B N 0 0 994 < 752 Overcast 91% cloud 12:00 -8.9 79 5 3 1B N 0 0 992 < 752 Overcast 81% cloud 15:00 -8.8 79 4 2 1B N 0 0 991 < 752 Overcast 100% cloud 18:00 -9 80 2 1 1B N 0.10 0.1 992 < 752 Overcast 100% cloud 21:00 -6.7 73 1 1 1B E 0 0 993 < 752 Overcast 100% cloud Monday, 09/11 00:00 -5.4 72 5 3 1B E 0 0 994 < 752 Overcast 100% cloud 03:00 -7.1 79 7 4 2B E 0 0 996 < 752 Overcast 95% cloud 06:00 -5.6 83 8 4 2B E 0.02 0 998 < 752 Overcast 82% cloud 09:00 -5.7 86 8 5 2B E 0.21 0.2 999 < 752 Overcast 97% cloud 12:00 -5.1 85 9 5 2B E 0.21 0.2 998 < 752 Overcast 100% cloud 15:00 -5.8 80 8 4 2B NE 0.13 0.1 995 < 752 Overcast 100% cloud 18:00 -5.8 67 7 4 2B N 0 0 989 < 752 Overcast 100% cloud 21:00 -4.5 73 6 3 2B NE 0.83 0.8 984 < 752 Overcast 100% cloud Tuesday, 10/11 00:00 -3.7 86 9 5 2B NE 4.4 3.4 980 < 752 Overcast 100% cloud 03:00 -2.3 91 11 6 2B E 5.9 2.4 977 < 752 Overcast 100% cloud 06:00 -2 85 7 4 2B NE 2.3 0.7 975 < 752 Overcast 98% cloud 09:00 -0.9 80 7 4 2B N 1.5 0.4 971 1048 Overcast 100% cloud 12:00 -1.4 93 5 3 1B NE 7.3 2.2 971 < 752 Overcast 100% cloud 15:00 -0.7 88 18 10 3B E 12.3 6.2 972 < 752 Overcast 100% cloud 18:00 -0.3 90 18 10 3B E 12.4 6.2 974 785 Overcast 100% cloud 21:00 0 92 18 10 3B E 13.5 6.7 978 851 Overcast 100% cloud Wednesday, 11/11 00:00 -0.2 91 15 8 3B E 7.3 2.9 981 791 Overcast 98% cloud 03:00 -0.7 92 13 7 3B E 5.7 2.3 983 < 752 Overcast 100% cloud 06:00 -1.3 93 8 4 2B E 2.7 0.8 984 < 752 Overcast 98% cloud |
|---|
Forecast notes
Forecast table times: UTC.
Coordinates: 60.9625868°N, -149.0708336°E · Requested elevation: 838 m. Model terrain: 750 m. Terrain and 1000/925/850/700 hPa profiles are used for height estimates.
These are altitude estimates, not a simulation of local mountain terrain. Precipitation, cloud and sea-level pressure use horizontal interpolation only.
Precipitation includes rain and snow water equivalent: preceding 3 hours through day 6, then 6 hours (see cell tooltip). Snow (cm) estimates fresh snowfall from precipitation and temperature using the GFS conversion; it is not snow depth on the ground. Freezing (m) uses additional 600/500 hPa temperatures when available and estimates the lowest resolved 0°C crossing above sea level. When all sampled levels are warm, the upper profile limit is shown (see tooltip). < marks an entirely cold sampled profile and its lower height limit. No extrapolation is used.